ThermoComfort is a web tool that lets students quickly share how comfortable they feel in campus spaces, helping make study areas cozier while cutting back on wasted energy.

Before ThermoComfort
After ThermoComfort
“It’d be nice if there were some warmer areas and colder areas for different body types...”
— Anonymous, 2016“Many people have been complaining that it is too hot on the 2nd and 3rd floor...”
— Anonymous, 2011“The 2nd floor PC lab is hot enough to make Libya feel like Siberia.”
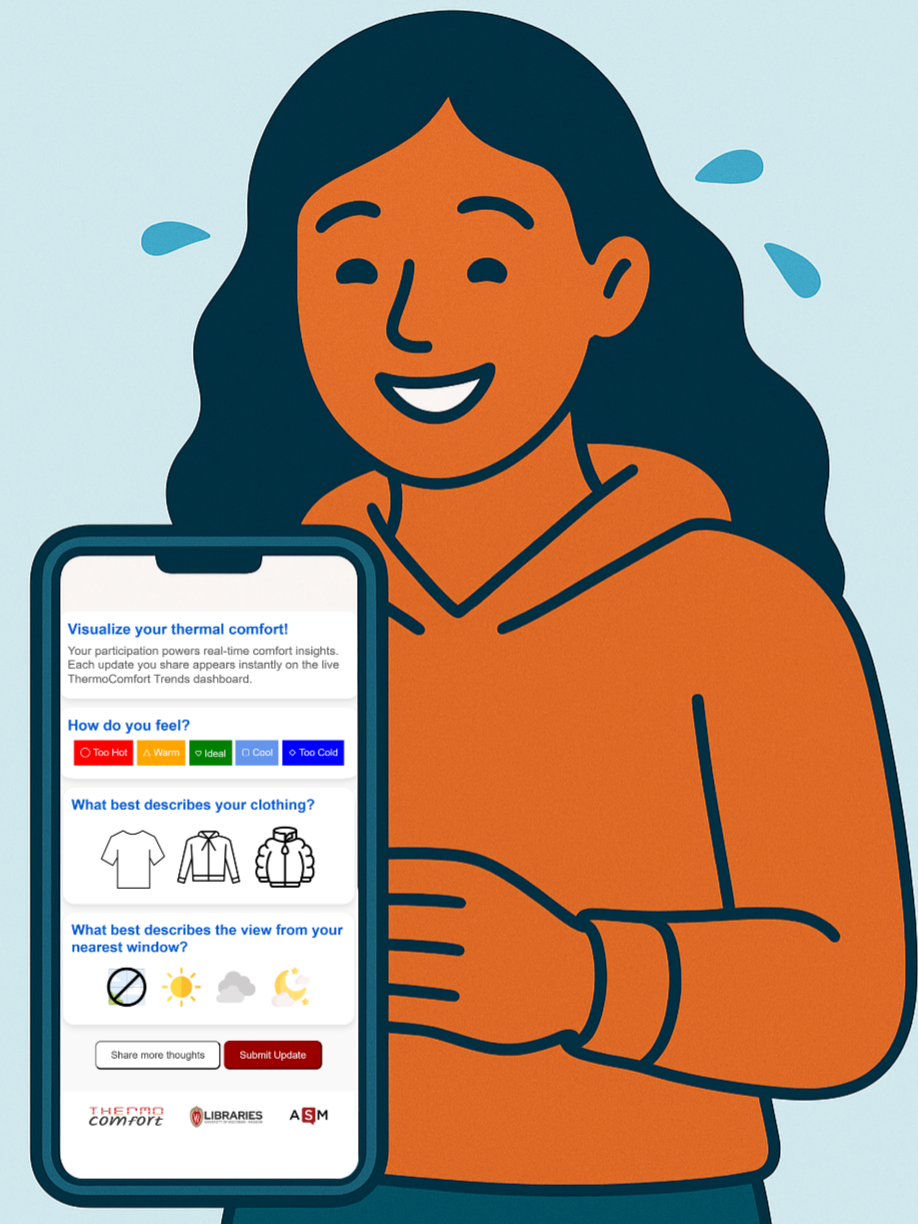
— Anonymous, 2007ThermoComfort connects student feedback on room comfort with real-time building data to create a balanced indoor environment. Here’s a quick walkthrough:
The dashboard visualizes student comfort data in real time across College Library. Each room is color-coded based on occupant feedback:
We believe student comfort matters — for learning, health, and sustainability. ThermoComfort gives students a voice and helps campus make energy-smart HVAC adjustments that balance comfort and efficiency.
Our first one-week pilot in College Library aims to gather comfort data and visualize hot and cold spots across spaces. This data will guide the next phase of building management improvements.
As a freshman, I found myself shivering in study rooms one morning and sweating in them by afternoon. Often, I felt fatigued and unfocused because the air flow wasn’t right for how many people were in the room.
I began to wonder: What if we could make invisible comfort experiences visible? That spark led me to build ThermoComfort.
In January 2025, during the heart of winter, I began actively working on this issue as an ASM Intern. ThermoComfort evolved into a web tool that empowers students to share real-time feedback about comfort and help campus make smarter energy choices.
With guidance from Alex Frank (Office of Sustainability), I discovered UC Davis’s TherMOOstat — a similar initiative that inspired ThermoComfort’s model. Building on that, I added a new feature: real-time, zone-specific visualization of comfort data.
I’m incredibly grateful for the opportunity to pilot this tool in College Library, thanks to Kelli Hughes and her incredible support, and to Ian Benton, Lisa Play and Pamela O’Donnell for making it come to life! I can’t wait to see how students engage with it.